In a previous post, I have explained the UK strategy to “fighting” the covid-19, based on a video in which the chief medical officer, Prof. Chris Whitty, answers questions to MPs. The video has been available on the internet since March 5th and appears to be the first more-or-less explicit declaration of intentions. Media did not pick it up but it all became clear after the PM’s first real press conference on March 12th.
While we know the general intention of the Government, nothing is known about the actual measures that will be undertaken or even considered. More importantly, nothing is known about the so-called “best available science” the PM is allegedly basing his actions on. I am personally not reinsured by the PM’s continuous appeal to science – even an expert observer may be excused to think the PM is creating a scapegoat to justify possible mistakes. I would argue that the choice of how one should fight the virus is almost exclusively a political one and has nothing to do with science. Science, on the other hand, can help mitigating damage for whichever path is chosen.
Given that the underlying model used by the CMO and by the nudge unit was not made available to the public (why?), I tried some back of the envelope calculations to recapitulate what I think the government may do. In other words, I tried to reverse engineer the model the government may be following using the following assumptions:
- The Government aims at obtaining herd immunity. With an R0 of 2.5, this implies hitting at least 65% of the UK population, which is a total of 43 million people. This is the lowest threshold to obtain herd immunity. We are looking, more realistically, at infecting 80% of the population – 53 million.
- The government aims at having a peak infection in 14 weeks from now (the first week of June)
- The government expects to have 95% of infection in the window of +- 10 weeks around the peak
- The government estimates that at of 12 March the country already had 10000 infections
Using these assumptions, I tried to recapitulate a SIR-like model the Government is trying to achieve. Remember it is difficult to do this without knowing all the measures the government claims to be considering, especially because many of those appear to be based on behavioural economics, the discipline behind the “nudge science”.
I found it would be impossible to delay the peak using the assumptions used above. It is simply too late unless the government plans an Italy-like lockdown now. I, therefore, assumed a) that the government is overestimating the actual number of current infections and b) the government will enter the mitigation phase next week. Both assumptions are extremely generous and probably unlikely.
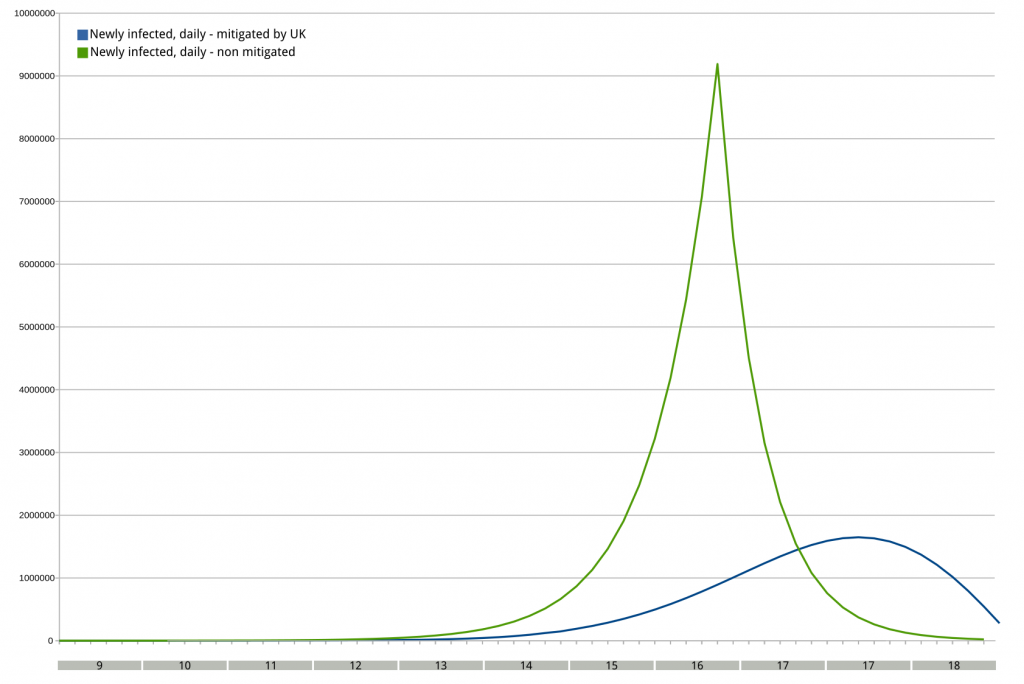
Figure 1 compares the unmitigated infection trend of covid-19 based on the infection data we have from other countries. The green line represents a totally unmitigated curve. The blue line represents the back of the envelope model. The total number of infected is different because an unmitigated model will reach a plateau (~80%) but a mitigated model may not.
For my model to work, the government should enter the mitigation phase sometimes next week and take at least some measures. One should remember that with a complete lockdown (e.g. Italian lockdown or Wuhan’s lockdown) it takes 14 days to affect the R0 of the contagion. During those 14 days, growth remains stable and exponential and no effect whatsoever is expected in terms of new cases. Assuming the government will implement at least a partial lockdown, we are looking at the blue curve below.
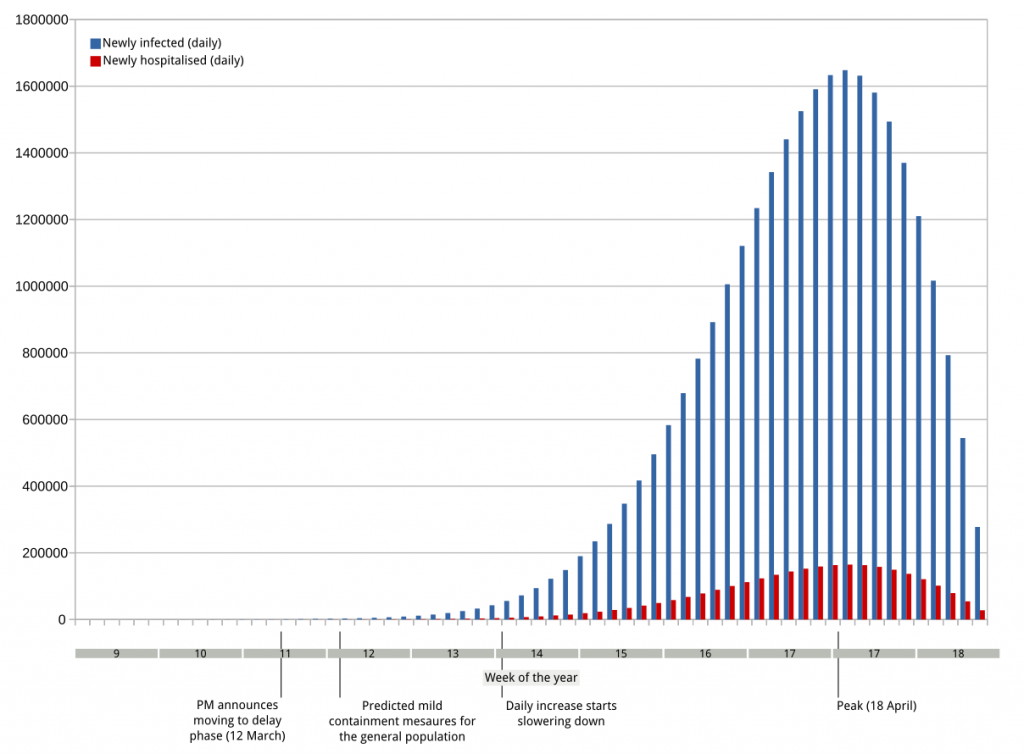
More important than the blue curve, is the red one. The red bars represent the expected number of hospitalizations per day. In Italy, the hospitalization rate is expected to be about 25% of the positives. Given the different demographics and given that the government plans to establish a cocooning for the at-risk categories (still to be started, weirdly), I used a much lower value of 10%. Again, if we had these models from the Government we would not have to guess and we scientists we would all feel much more relieved.
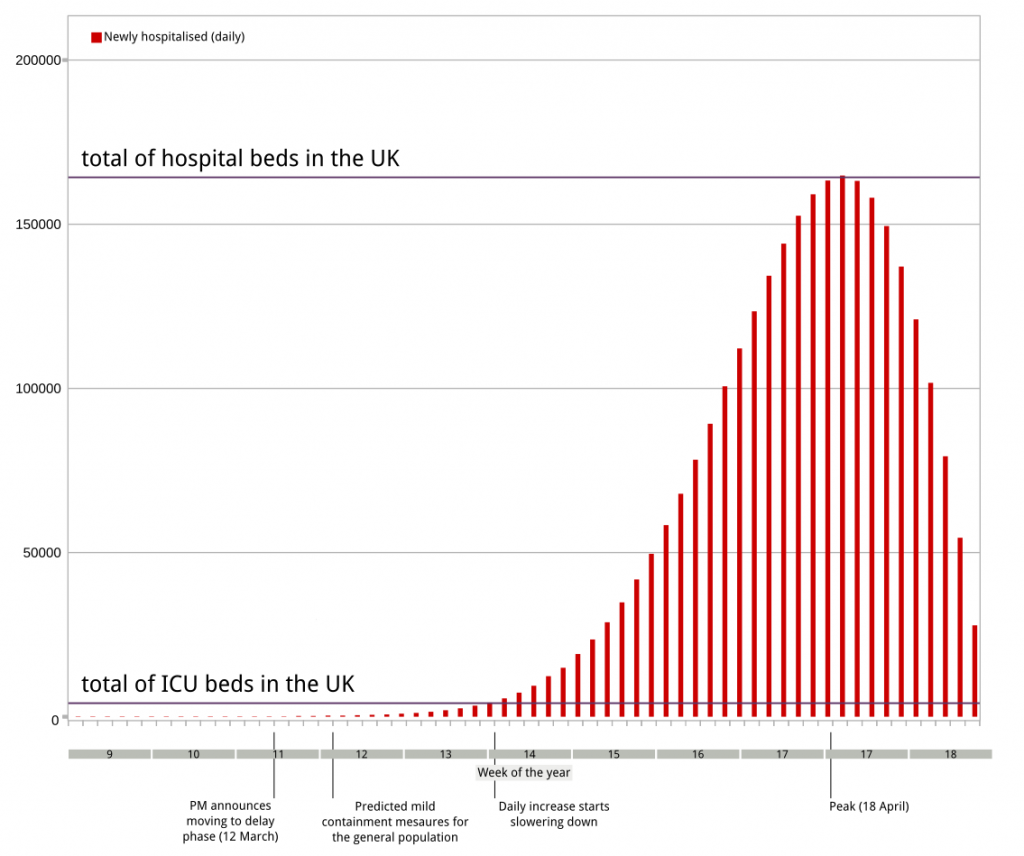
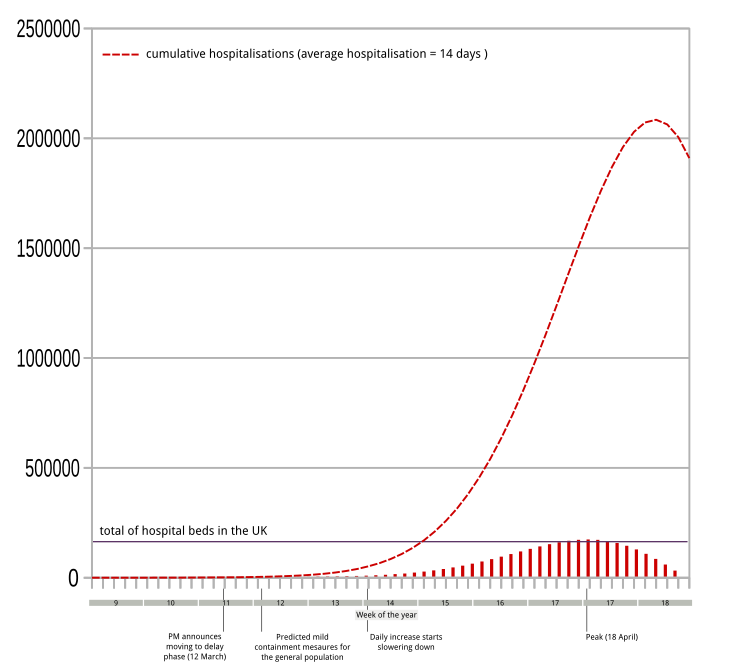
Given the model, how would the NHS cope with this? Barely. The whole of the UK can count on 4200 intensive care units (ICU) beds. All the NHS has 160.000 beds in total – this includes all wards. In normal conditions, hospital beds are used at 80% capacity, meaning that we can effectively count on only 20% of those unless we assume every other patient will be sent home. Moreover, the hospitalisation time in Italy ranges between 1 and 2 weeks, during which the patients recover from viral pneumonia. Therefore one has to look at the new daily hospitalisation in a partly cumulative fashion! When we do account for the cumulative properties of hospitalisation (that is, we account for the fact patients would need to stay in hospital at least 14 days) this is what it looks like
Summary
A simple and extremely generous approximation of the government model predicts a situation that is not compatible with current NHS capabilities.
Conclusions
- Even if mild measures are taken next week, the NHS will not be able to cope with the predicted rate of hospitalisations.
- Younger covid patients (below 65 years of age) will probably be hospitalised at least the in the first phase of the contagion, assuming most regular beds will be converted into ICU beds
- Most covid19 patients (70+) will not hospitalised and a possible compassionate approach will be taken instead, letting them meet their fate at home.
Of course, my model may be wrong – there is only a way to find out! Please ask the government to release their plans now. #releasethemodel
Comments are closed, but trackbacks and pingbacks are open.